
Disclaimer:
This blog post is intended for educational purposes only. It is not suitable for production use and should never be exposed to the public internet without implementing proper security measures.
This setup is not intended for production use and isn’t advanced enough to emulate a full real world engagement. It lacks many other operational components. However, it goes beyond a basic lab; it’s more than just a simple EC2 redirector linked to a domain forwarding traffic to a C2.
The architecture looks like this:
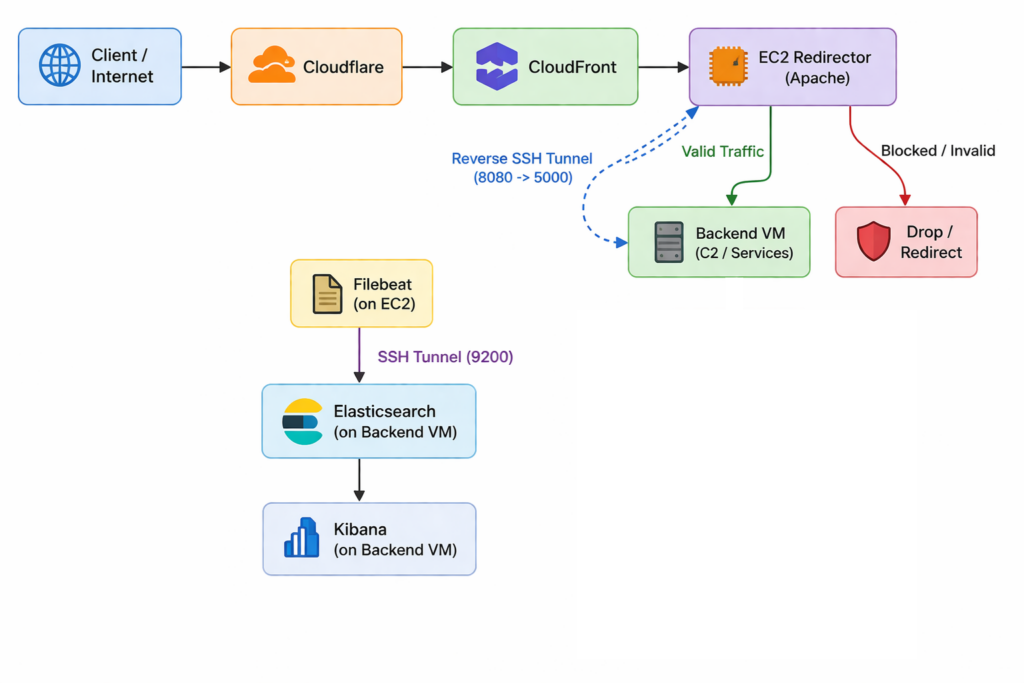
Each layer exists for a reason.
Cloudflare sits at the edge, providing DNS management, TLS termination, and basic WAF protections. It’s the first layer that masks your origin.
CloudFront introduces a CDN layer, hiding the EC2 instance behind an additional abstraction while normalizing traffic patterns and forwarding headers in controlled ways.
At the heart of the lab is the EC2 redirector, an Apache server configured with custom rewrite rules and proxying. It’s where all inbound traffic is filtered, shaped, and logged, making it your primary sensor.
Behind it, a VM runs as a hidden backend, accessible only through an SSH tunnel. This allows you to simulate C2 servers or internal services without ever exposing them to the public internet.
Elasticsearch and Kibana sit on the visibility layer, collecting and showing logs in near real-time so you can quickly spot patterns and unusual activity, while Filebeat quietly sends those logs off the redirector to make sure the data is kept safe even if the front end goes down.
Picking a Domain
To make the lab realistic, I used a registered domain, [REDUCTED].co.uk. We will not focus on the registration process itself, but having a real domain is essential, If you reading this blog so you are far beyond that.
The domain is to allows you to integrate Cloudflare and CloudFront properly, and to use TLS certificates from AWS Certificate Manager (ACM).
Once the domain was ready, we pointed it to Cloudflare by updating the domain’s NS records. After that, we enabled the proxy on the DNS record, which masked the EC2 origin and allowed us to configure edge TLS.
Using Full (Strict) mode ensures encryption is enforced all the way to the origin, which adds a realistic defensive layer to the lab.
Note: Since CloudFront isn’t set up yet, you can point your domain directly to the EC2 public IP for now.
Launching the EC2 Redirector
The EC2 instance is the core of the lab. Launch an Ubuntu instance, set up an SSH key pair, and configure inbound rules.
For lab purposes, open ports 80 and 443 for CloudFront traffic, and restrict SSH to your own IP.
Install Apache and enable the required modules: rewrite, proxy, proxy_http, ssl, and headers:
apt install apache2 -y
a2enmod rewrite proxy proxy_http ssl headers
Modify the default site config:
nano /etc/apache2/sites-available/000-default.confAdd:
    <Directory /var/www/html>
            Options Indexes FollowSymLinks MultiViews
            AllowOverride All
            Require all granted
    </Directory>
Restart Apache to apply the changes:
systemctl restart apache2The goal isn’t just to serve content, but to build a flexible redirector that filters traffic, controls access, and logs everything.
Use .htaccess rules as the decision engine:
RewriteEngine on

# Block scanners
RewriteCond %{HTTP_USER_AGENT} (curl|wget|nmap) [NC]
RewriteRule ^.*$ - [F,L]

# Allow valid GET requests
RewriteCond %{REQUEST_METHOD} GET [NC]
RewriteCond %{REQUEST_URI} ^/event.gif$
RewriteCond %{QUERY_STRING} ^id=[a-z0-9]{6,}$
RewriteCond %{HTTP_USER_AGENT} (Mozilla|Chrome|Safari|Edge) [NC]
RewriteRule ^.*$ http://127.0.0.1:8080%{REQUEST_URI} [P,L]

# Allow valid POST requests
RewriteCond %{REQUEST_METHOD} POST [NC]
RewriteCond %{REQUEST_URI} ^/submit.gif$
RewriteRule ^.*$ http://127.0.0.1:8080%{REQUEST_URI} [P,L]

# Redirect Everything else
RewriteRule ^.*$ https://www.x.com [R=302,L]
These rules allow clean traffic to reach the backend, while scanners, bots, and malformed requests are blocked or redirected.
Configuring TLS and CloudFront
To serve traffic securely, I requested a public ACM certificate for my domain *.[REDUCTED].co.uk
CloudFront requires certificates in us-east-1, so I validated it via DNS by adding the CNAME provided by ACM into Cloudflare.
With the certificate issued, I created a CloudFront distribution using the EC2 redirector as the origin.
Initially, I configured HTTPS to an HTTP-only EC2 instance, which resulted in persistent 502 errors. Switching the origin protocol to HTTP resolved the issue immediately, while CloudFront still handled TLS at the edge.
CloudFront was configured to:
- Forward all headers
- Forward query strings
- Forward cookies
This is critical, because the redirector’s filtering logic depends on those values.
For dynamic endpoints like /event.gif, caching was disabled to ensure every request reaches the redirector and gets logged.
SSH Tunnel and Backend Simulation
The VM sits behind the redirector, completely hidden.
To connect it, use a reverse SSH tunnel (from the backend VM to the EC2 instance):
ssh -i ec2_key.pem -R 8080:localhost:5000 ubuntu@EC2_PUBLIC_IPThis detail is important, the command runs from the backend, not the redirector.
What this does:
- Opens
localhost:8080on EC2 - Forwards it to port
5000on the backend VM
Now, the EC2 redirector can proxy traffic to the backend without exposing it publicly.
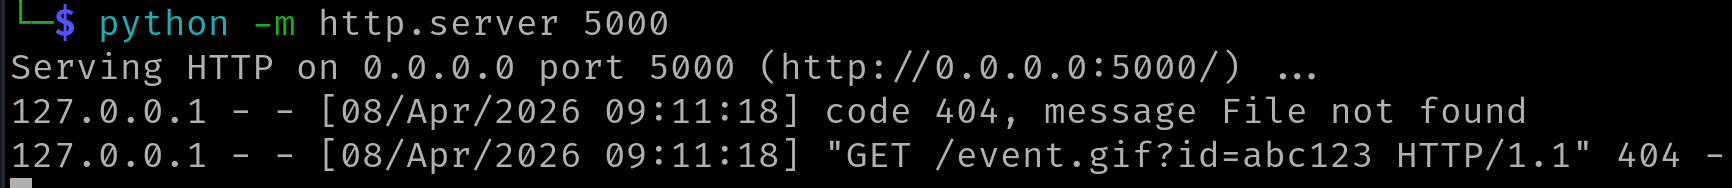
On the backend, for now, ran a simple HTTP server:
python3 -m http.server 5000(This will be replaced by your C2 software (nighthawk, cobalt strike, yout custom c2, … ))
This allows end to end testing:
Client → Cloudflare → CloudFront → EC2 → Backend (C2)
Logs on the redirector clearly show which traffic is allowed, blocked, or redirected.
Observing Traffic and Building Insights
With this setup, it’s easy to simulate normal vs. suspicious traffic.
Valid requests like:
https://events.[REDUCTED].co.uk/event.gif?id=gif123reach the backend.
Meanwhile:
- Scanners
- Bots
- Random probes
are blocked or redirected.
By integrating Filebeat and the ELK stack, you can ship Apache logs from the redirector and visualize them in Kibana, turning this into a real analysis platform.
Note: the redirector is your primary sensor not the backend.
It’s where you observe behavior, enforce logic, and experiment with detection.
Turning the Redirector into a Sensor: Real IP + Kibana
At this point, your infrastructure works:
Client → Cloudflare → CloudFront → EC2 → Backend (C2)
But if you check Apache logs, you’ll notice something frustrating:
Every request appears to come from CloudFront (or Cloudflare), not the real client!
This is a problem, because in real environments source attribution is critical
Understanding the Problem: Lost Client Identity
When traffic passes through layers like Cloudflare and CloudFront, each layer terminates the connection and forwards it.
As a result, Apache sees:
- CloudFront IP
- Or Cloudflare IP
Not the real client.
However, the original IP is preserved in headers:
X-Forwarded-ForCF-Connecting-IP(Cloudflare-specific)
Your goal is to extract and trust the correct one.
1. Enable Real Client IP in Apache
On the EC2 redirector:
sudo a2enmod remoteip
sudo systemctl restart apache2
Edit the config:
sudo nano /etc/apache2/apache2.confAdd:
<IfModule mod_remoteip.c>
    RemoteIPHeader X-Forwarded-For
    RemoteIPTrustedProxy 127.0.0.1
    RemoteIPTrustedProxy 10.0.0.0/8
    RemoteIPTrustedProxy 172.16.0.0/12
    RemoteIPTrustedProxy 192.168.0.0/16
</IfModule>
Then test and restart:
sudo apachectl configtest
sudo systemctl restart apache2
For lab purposes, trusting private networks and localhost is sufficient.
In a real setup, you should restrict RemoteIPTrustedProxy to Cloudflare and CloudFront IP ranges only.
2. Update Log Format
Modify the log format so Apache records the real client IP:
LogFormat "%a %l %u %t \"%r\" %>s %O \"%{Referer}i\" \"%{User-Agent}i\"" combined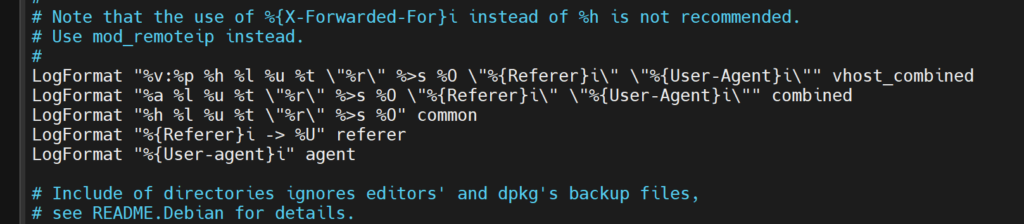
Here:
%anow reflects the true client IP, not the proxy
Restart Apache:
sudo systemctl restart apache2What You Just Gained
Now when you check logs:
sudo tail -f /var/log/apache2/access.logYou’ll see:
- Real client IP
- User agent
- Request path
- Response status
From Raw Logs to Real Visibility
At this stage, the redirector is doing its job; filtering traffic, proxying only what you allow, and logging everything that touches it. But those logs, sitting in /var/log/apache2/access.log, are just raw text. Useful, but limited.
What transforms this setup into something genuinely valuable is not just collecting logs, but treating them as a data stream you can analyse, query, and learn from.
That’s where the ELK stack comes in.
Kibana, backed by Elasticsearch, turns your lab into something more than infrastructure:
Rethinking Where Logs Should Live
The obvious approach is to install Elasticsearch and Kibana directly on the EC2 redirector. It works, it’s quick, and for a first iteration it’s perfectly fine.
But there’s a subtle flaw in that design.
The redirector is the most exposed component in your architecture. It’s the one receiving probes, scans, and potentially being fingerprinted. If that system is burned or taken down, you don’t just lose the redirector, you lose your logs too.
So instead of turning the EC2 instance into both a proxy and a logging system, it’s better to treat it for what it really is:
A sensor that forwards data elsewhere
In this setup, Elasticsearch and Kibana live on the backend VM, the same isolated machine you’re already using for your internal simulation. The redirector simply ships logs to it.
Installing the Analysis Layer (Backend VM)
On the backend VM, Elasticsearch and Kibana are installed and run locally. Nothing is exposed to the internet, everything stays internal.
sudo apt install apt-transport-https curl -y
curl -fsSL https://artifacts.elastic.co/GPG-KEY-elasticsearch \
| sudo gpg --dearmor -o /usr/share/keyrings/elastic.gpg

echo "deb [signed-by=/usr/share/keyrings/elastic.gpg] https://artifacts.elastic.co/packages/8.x/apt stable main" \
| sudo tee /etc/apt/sources.list.d/elastic-8.x.list

sudo apt update
sudo apt install elasticsearch kibana -y
Start the services:
sudo systemctl enable elasticsearch
sudo systemctl start elasticsearch
sudo systemctl enable kibana
sudo systemctl start kibana
For lab simplicity, disable security (That’s very important)
xpack.security.enabled: falseMake sure the VM has at least 4–5 GB free disk space, otherwise Elasticsearch may fail silently or behave unpredictably.
At this point, your backend VM becomes the analysis node of your lab.
Shipping Logs Instead of Keeping Them
At this stage, the redirector is generating logs, but they are still local to the EC2 instance. That’s convenient, but not ideal, anything on the redirector should be treated as temporary.
Instead, Filebeat ships logs off the box entirely.
Install Filebeat:
sudo apt update
sudo apt install curl gnupg -y

curl -fsSL https://artifacts.elastic.co/GPG-KEY-elasticsearch \
| sudo gpg --dearmor -o /usr/share/keyrings/elastic.gpg

echo "deb [signed-by=/usr/share/keyrings/elastic.gpg] https://artifacts.elastic.co/packages/8.x/apt stable main" \
| sudo tee /etc/apt/sources.list.d/elastic-8.x.list

sudo apt update
sudo apt install filebeat -y
Enable the Apache module:
sudo filebeat modules enable apacheUsing the Tunnel for Log Transport
Rather than exposing Elasticsearch to the internet, reuse the reverse SSH tunnel approach.
From the backend VM:
ssh -i ec2_key.pem -R 9200:localhost:9200 ubuntu@EC2_PUBLIC_IPThis creates:
localhost:9200 on EC2 → forwarded to Elasticsearch on the backend
From the redirector’s perspective, Elasticsearch appears local, but it’s actually hidden.
Pointing Filebeat to the Backend
On the EC2 redirector:
sudo nano /etc/filebeat/filebeat.ymlEnsure:
output.elasticsearch:
hosts: ["localhost:9200"]
Edit the Apache module:
sudo nano /etc/filebeat/modules.d/apache.ymlMake sure at least one fileset is enabled:
module: apache
access:
enabled: true
var.paths: ["/var/log/apache2/access.log*"]
error:
enabled: true
var.paths: ["/var/log/apache2/error.log*"]
Without this, Filebeat will fail with:
module apache is configured but has no enabled filesets
Restart Filebeat:
sudo systemctl restart filebeat
sudo systemctl status filebeat
Note:
You may encounter an error when running"sudo filebeat setup"that says it cannot connect to Kibana athttp://localhost:5601. This is expected in your setup because Kibana is running on the backend VM, not locally. Therefore, you do not need to run filebeat setup on the EC2 instance.
Accessing Kibana
Kibana runs only on the backend VM:
http://localhost:5601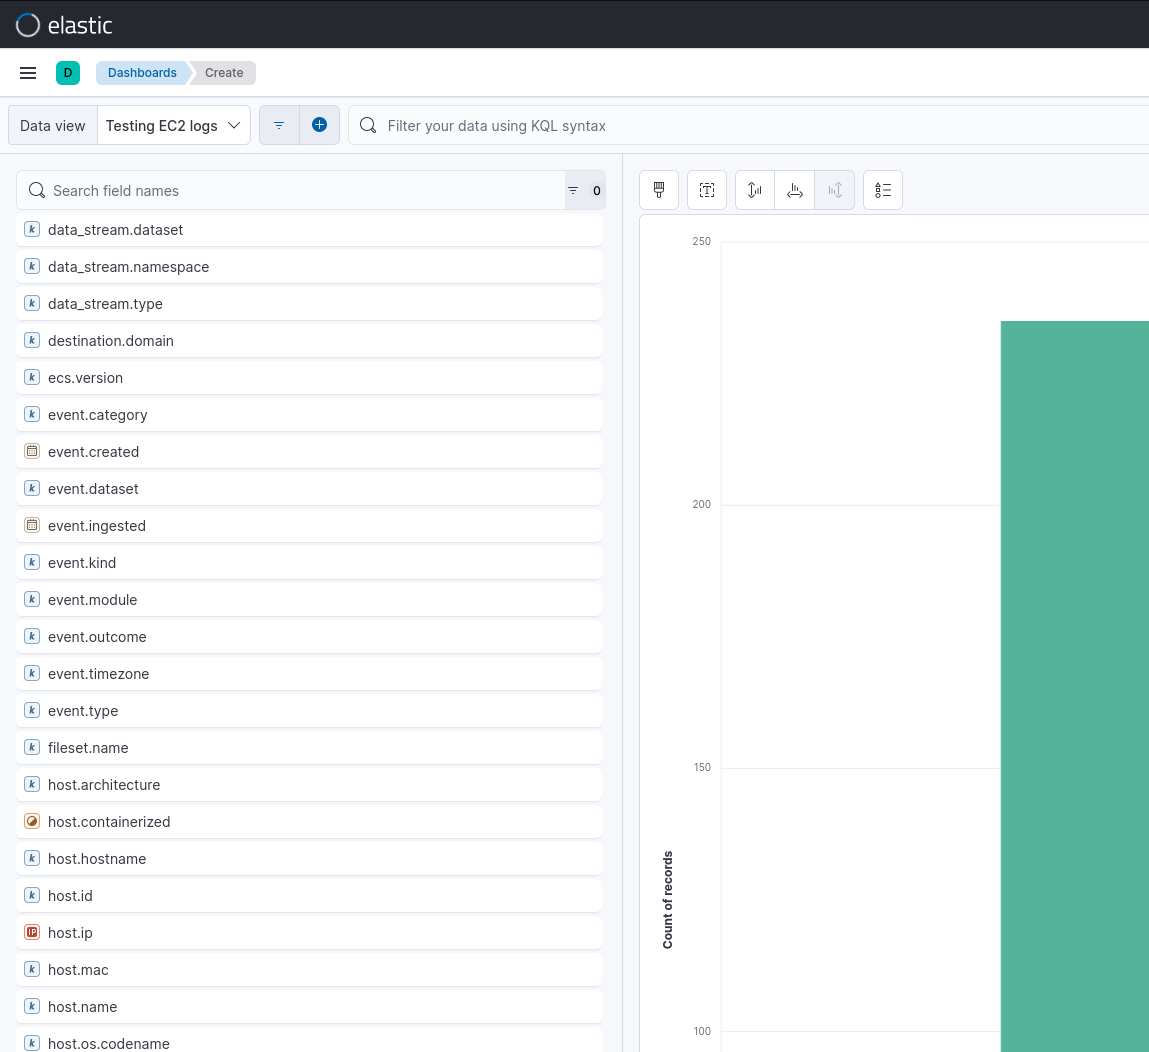
What This Changes
This small shift, moving logs off the redirector fundamentally changes the lab.
You now have:
- Persistence → logs survive redirector loss
- Centralisation → multiple sensors can feed one backend
- Separation of roles → collection vs analysis
And most importantly:
You’ re now mirroring how real environments are built.
Making the Data Richer
Once logs are flowing, enrich what you capture.
Update Apache log format:
LogFormat "%a %l %u %t \"%r\" %>s %b \"%{User-Agent}i\" \"%{X-Forwarded-For}i\" \"%{CF-Connecting-IP}i\"" combinedNow you capture:
- Real IP (
%a) - Proxy chain (
X-Forwarded-For) - Cloudflare origin (
CF-Connecting-IP)
This gives you full visibility into how traffic traverses layers.
Where the Lab Becomes Interesting
At this point, the lab shifts from functionality to observation.
You’ll start noticing patterns:
- Scanners exposing themselves via user agents
- Random probes (
/wp-login.php,/admin) - Clean, structured beacon-like traffic
- Differences between allowed and blocked requests
This is where the lab becomes genuinely useful — not just for red teaming, but for understanding how behaviour is detected.
Automating the Lab with Terraform
Now that we’ve built the lab step by step, there’s a better way: automation. Doing this manually is fine for learning, but if you want to spin up multiple instances, rebuild the lab after testing, or just make your life easier, Terraform is your friend.
Terraform lets you describe your entire lab as code. You define your EC2 redirector, security groups, CloudFront distribution, and ACM certificate once, and with a single command, AWS spins it all up exactly the way you want. No guesswork, no missed steps.
To make life even easier, I’ve uploaded the full Terraform script to my GitHub account. Grab it, tweak your variables, and you’ll have a fully working lab up and running in minutes.
Check it out here: https://github.com/salahelsheikh/behind-curtain-lab